Documentation Index
Fetch the complete documentation index at: https://support.eqtble.com/llms.txt
Use this file to discover all available pages before exploring further.
Quick Start
1. Navigating Stories
Stories can be accessed by clicking on the ‘All Stories’ tab in the navigation side menu. You will then be redirected to the Stories dashboard, where you can view a list of all the available stories in your organization.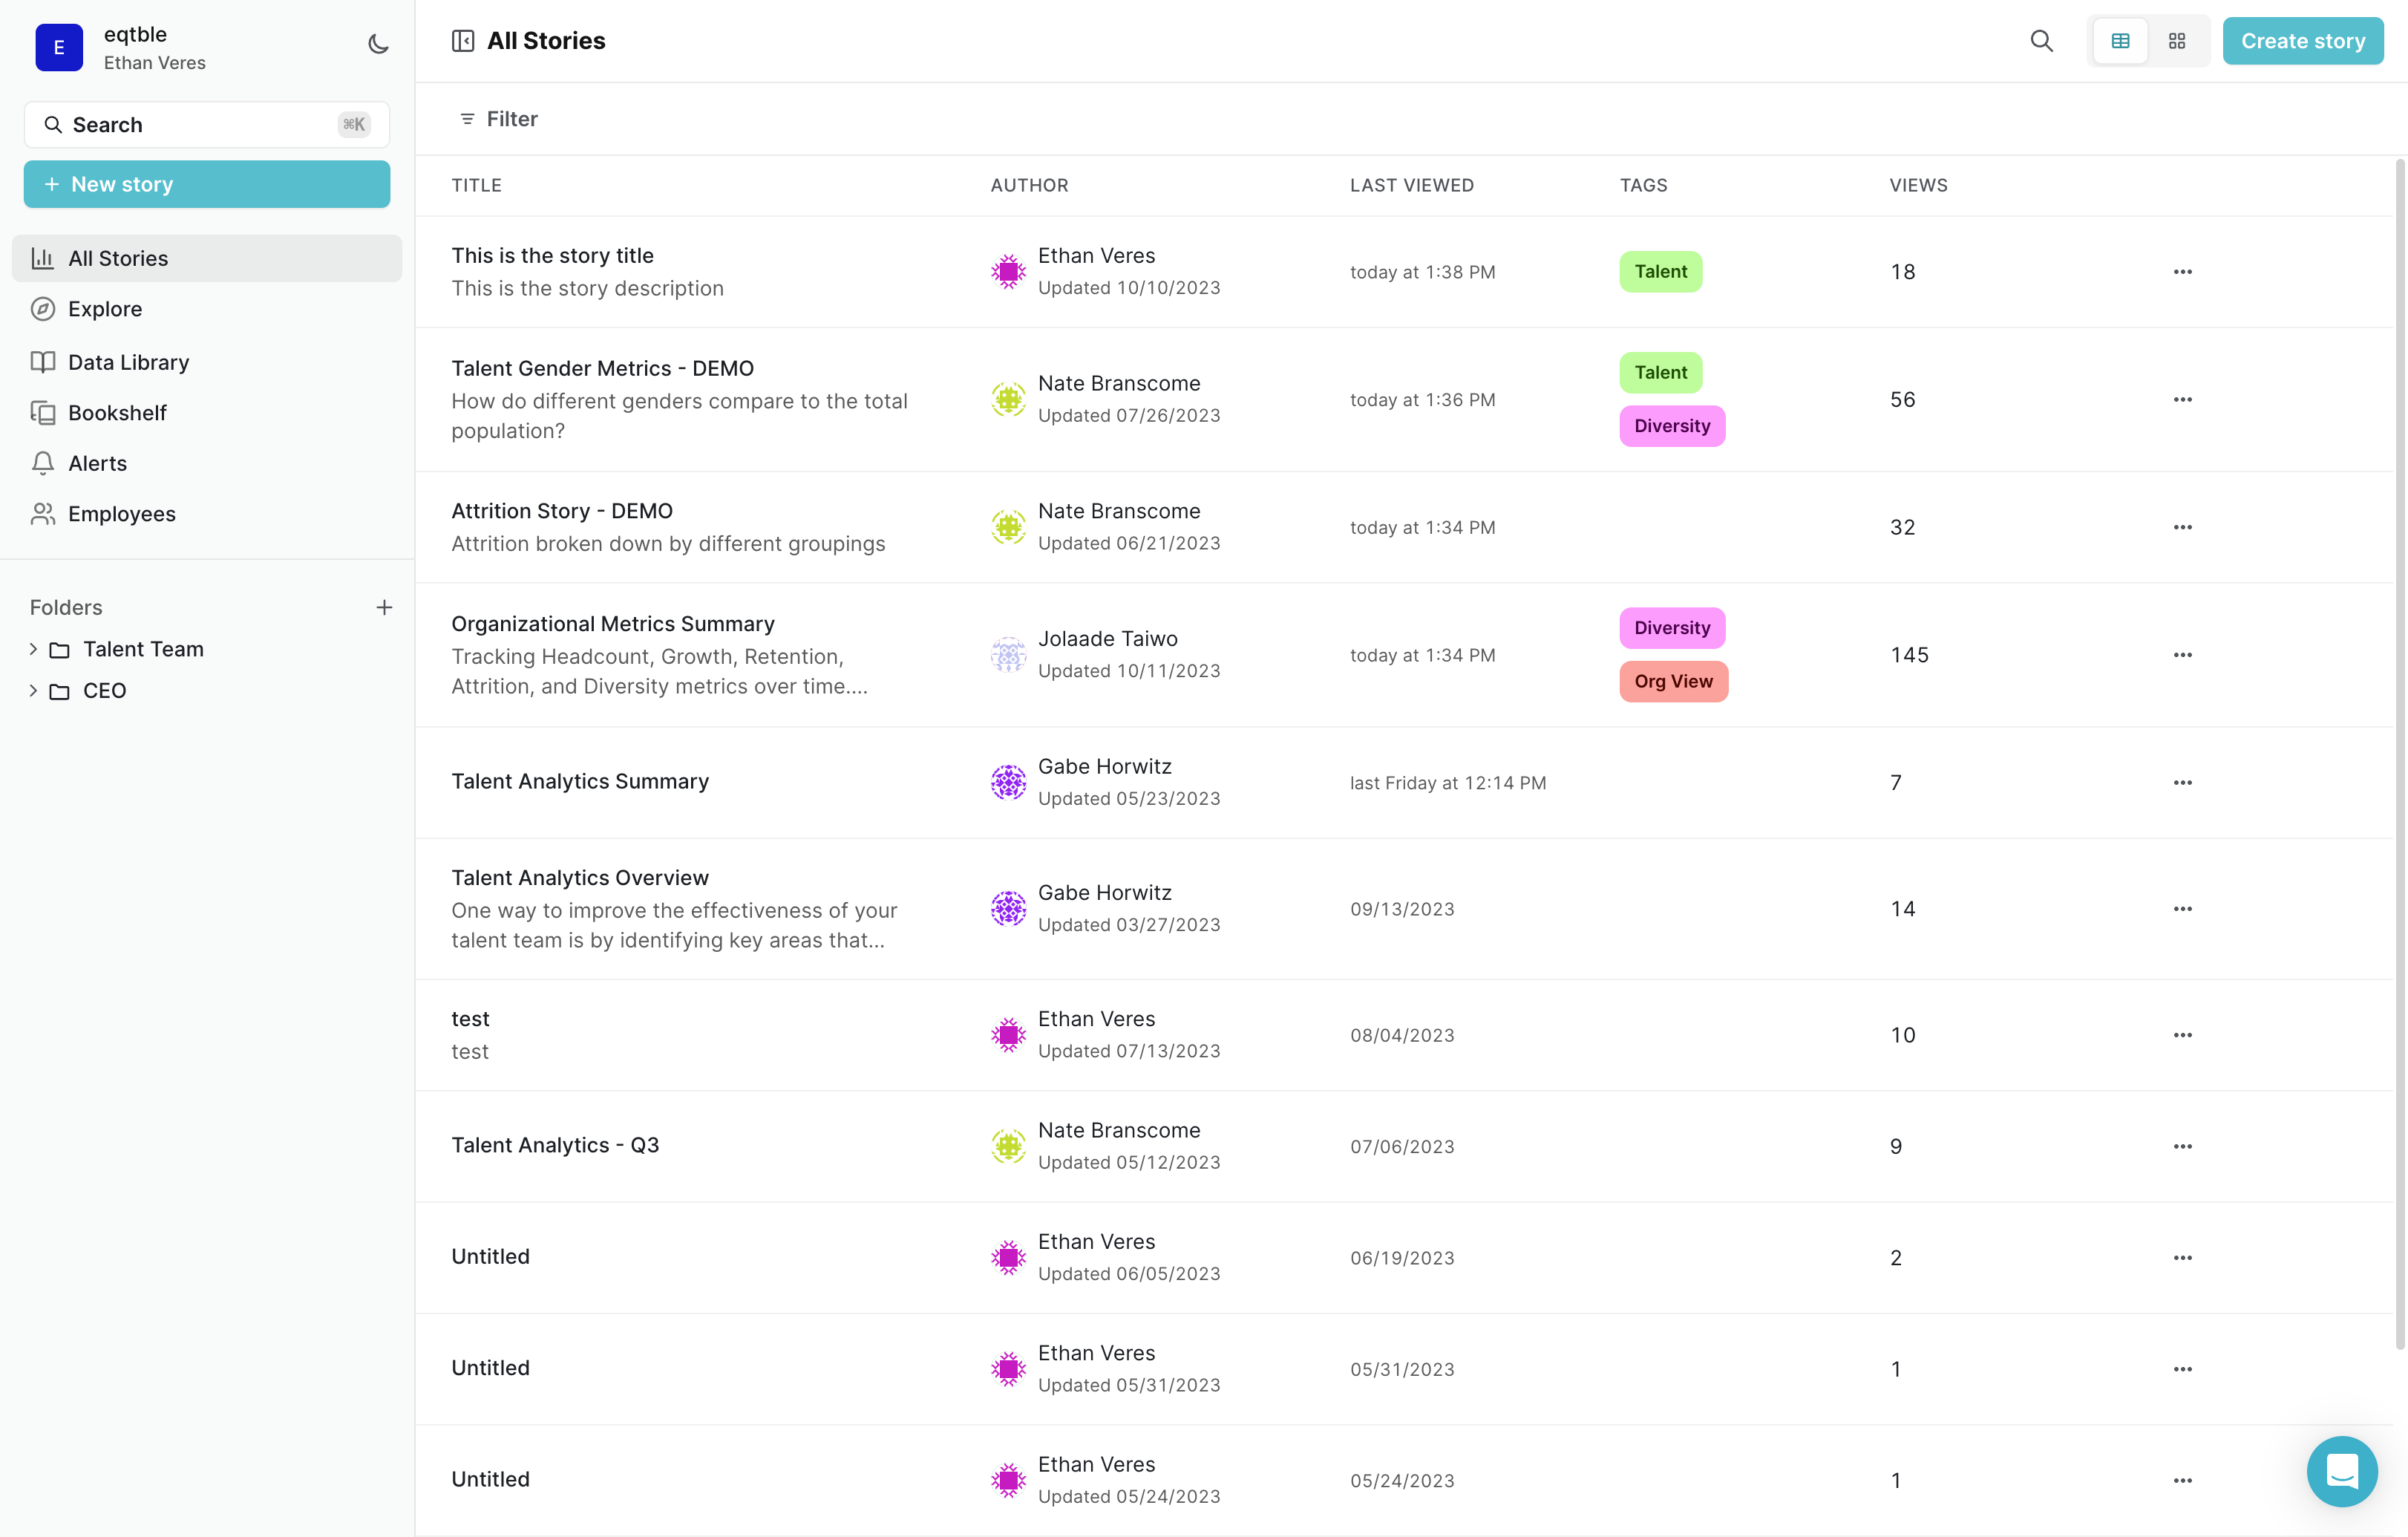
2. Creating a New Story
To create a new story, click on the ‘Create story’ button located in the top right corner of the Stories dashboard or the ‘New story’ button at the top of the left sidebar. You will be redirected to your new story. Once you have created a new story, add a title and description. Our ‘recommended metrics’ feature suggests specific charts to include in your story based on the title. This helps you quickly create a visually compelling and data-driven narrative.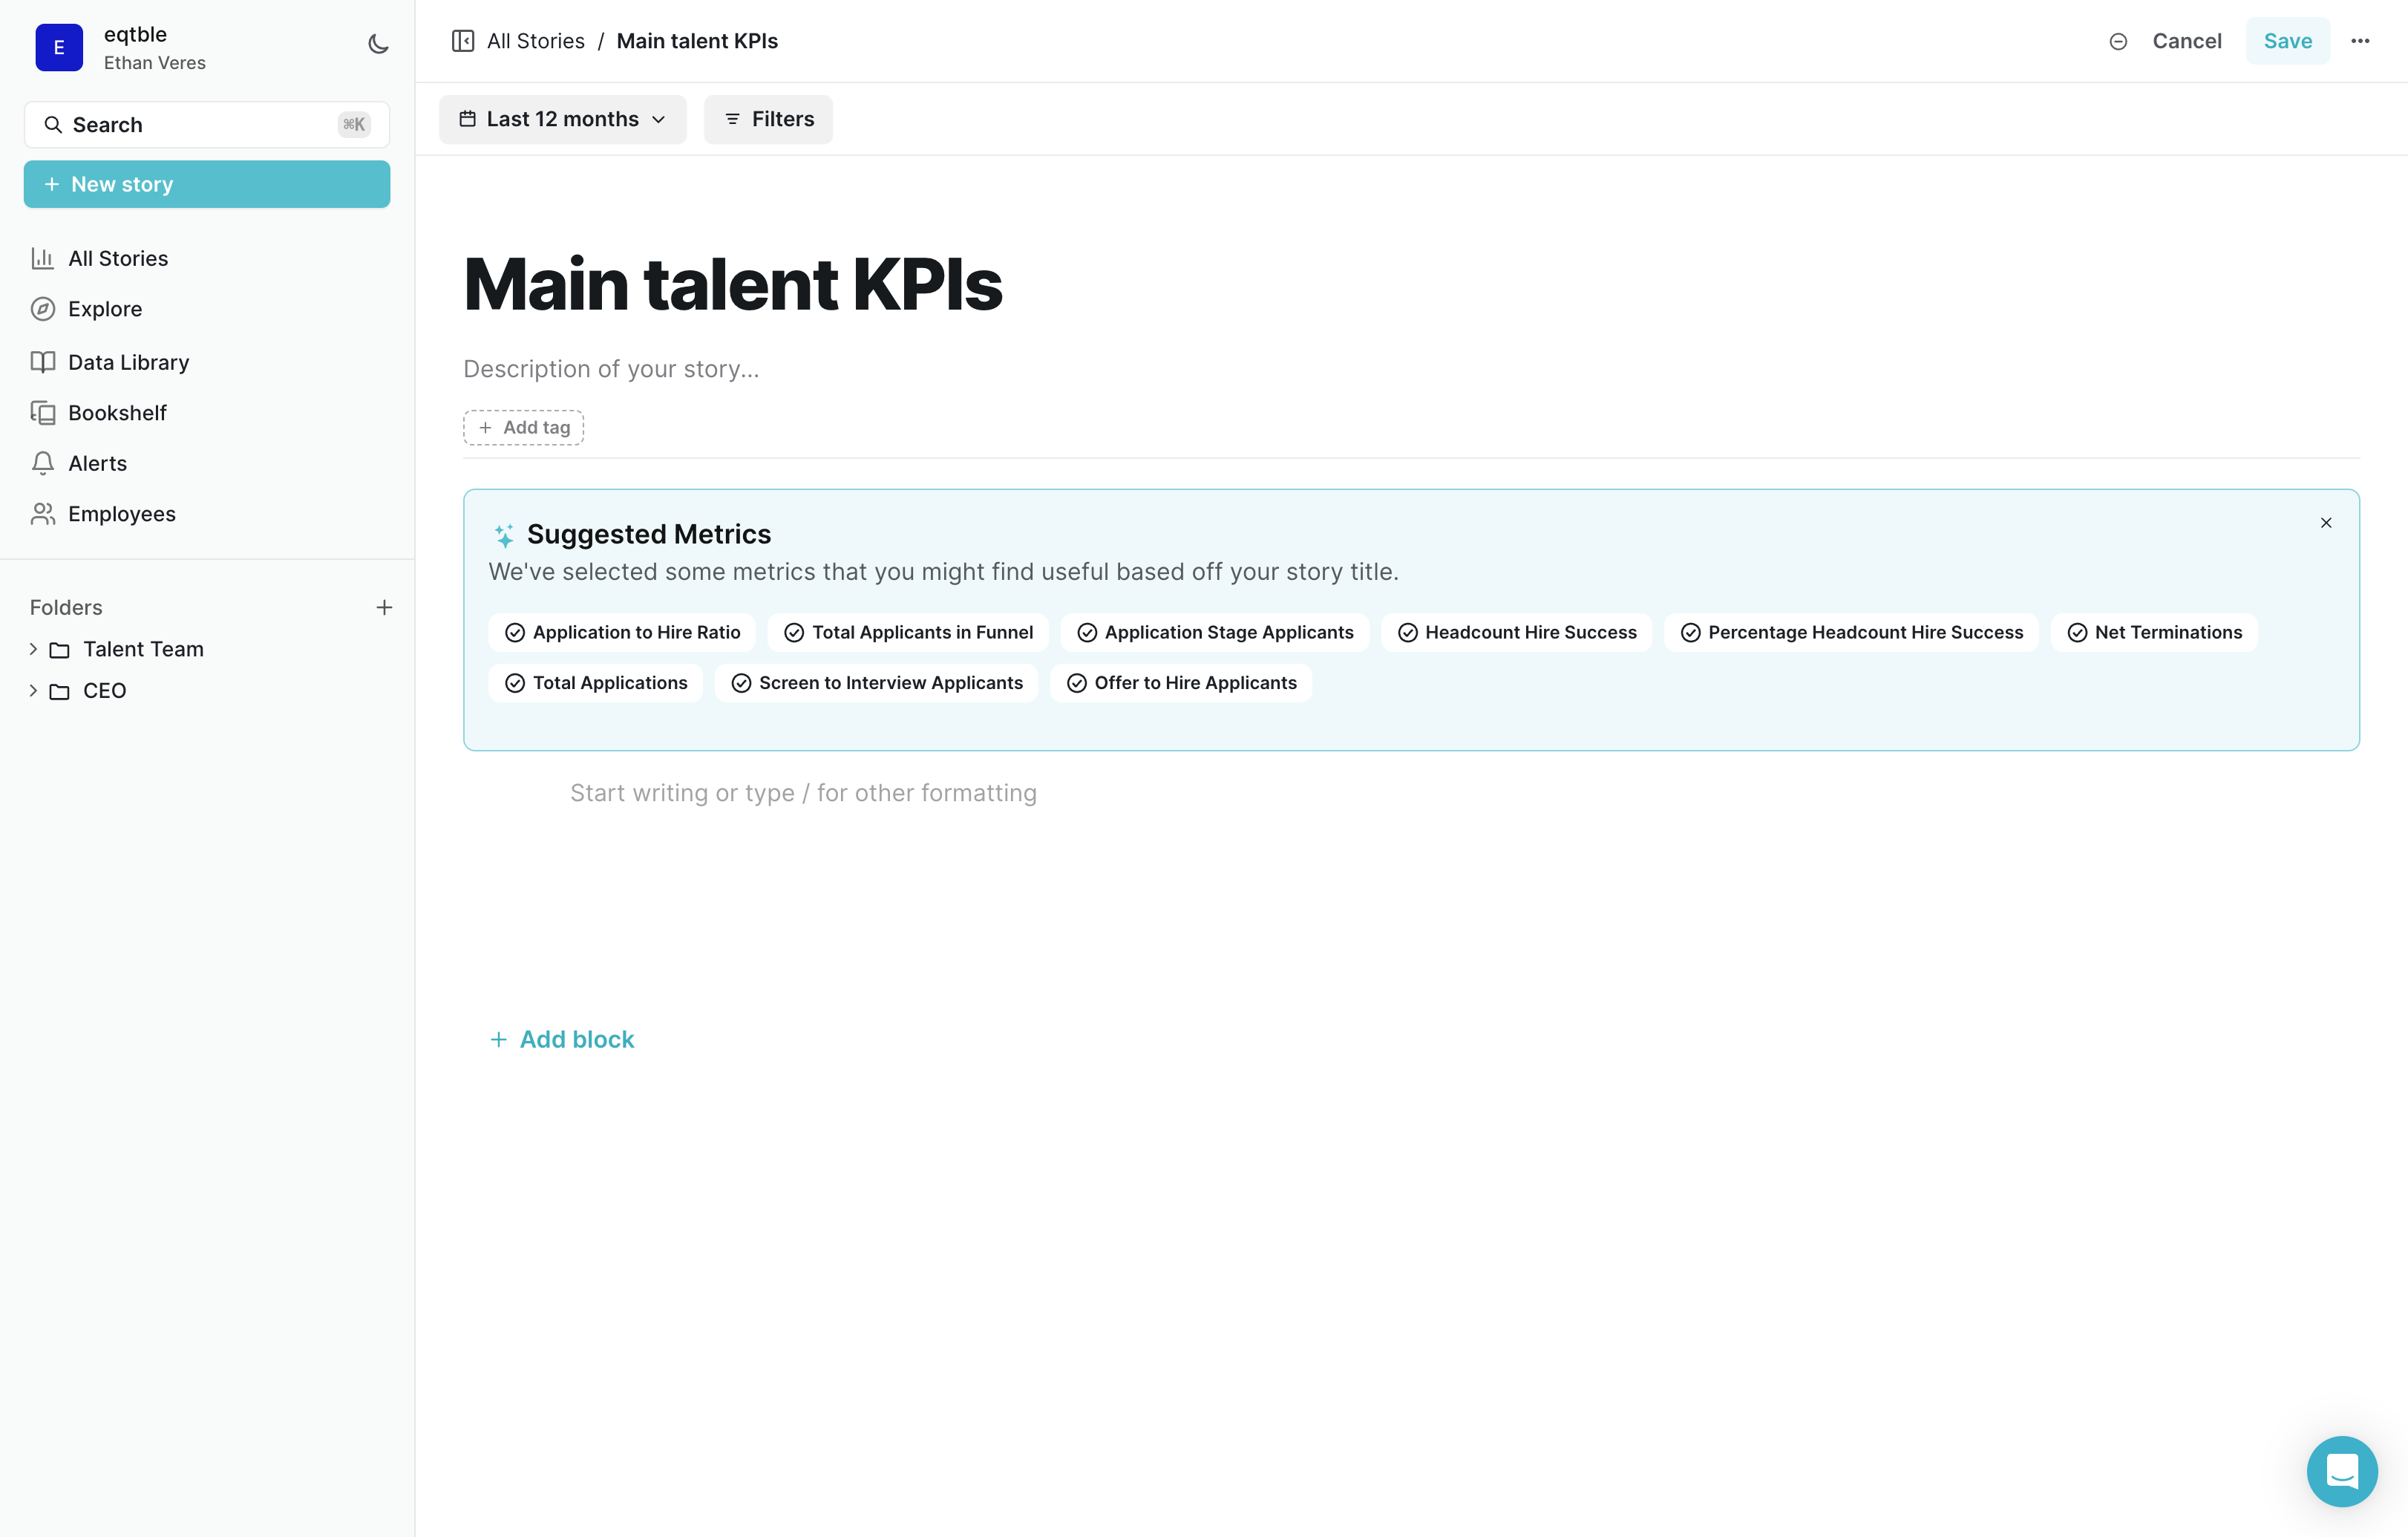
3. Adding content to your Story
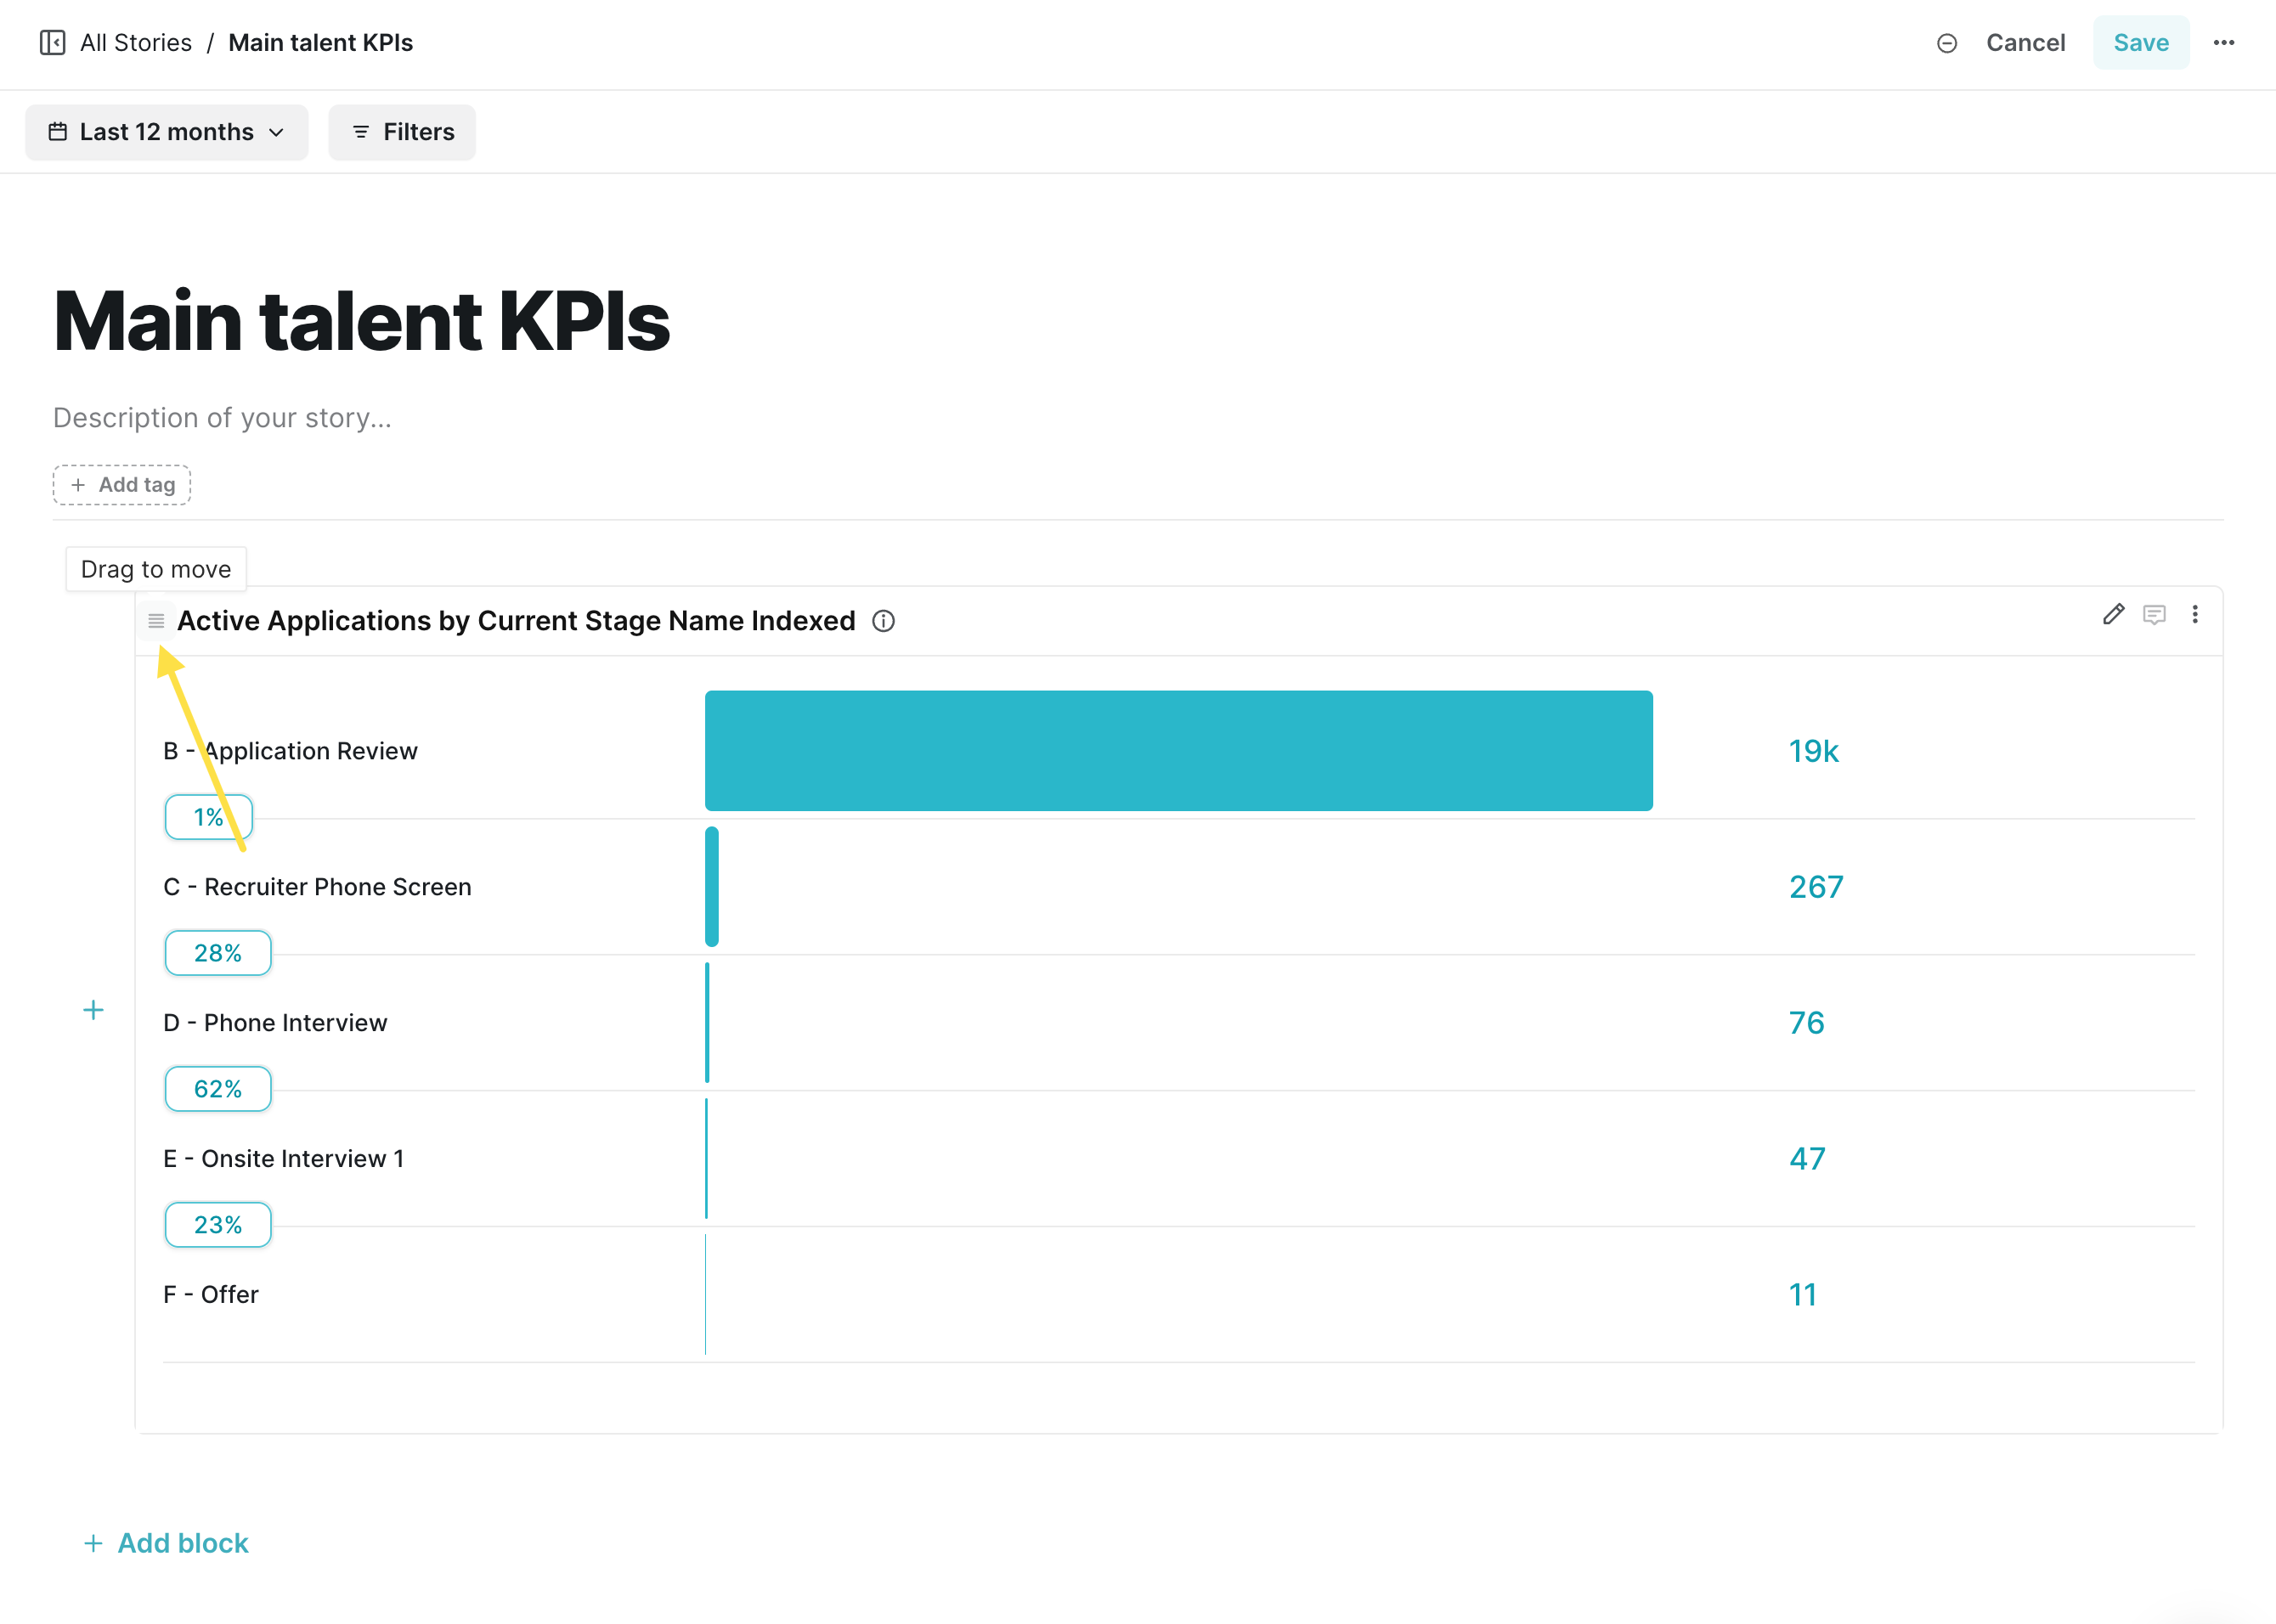
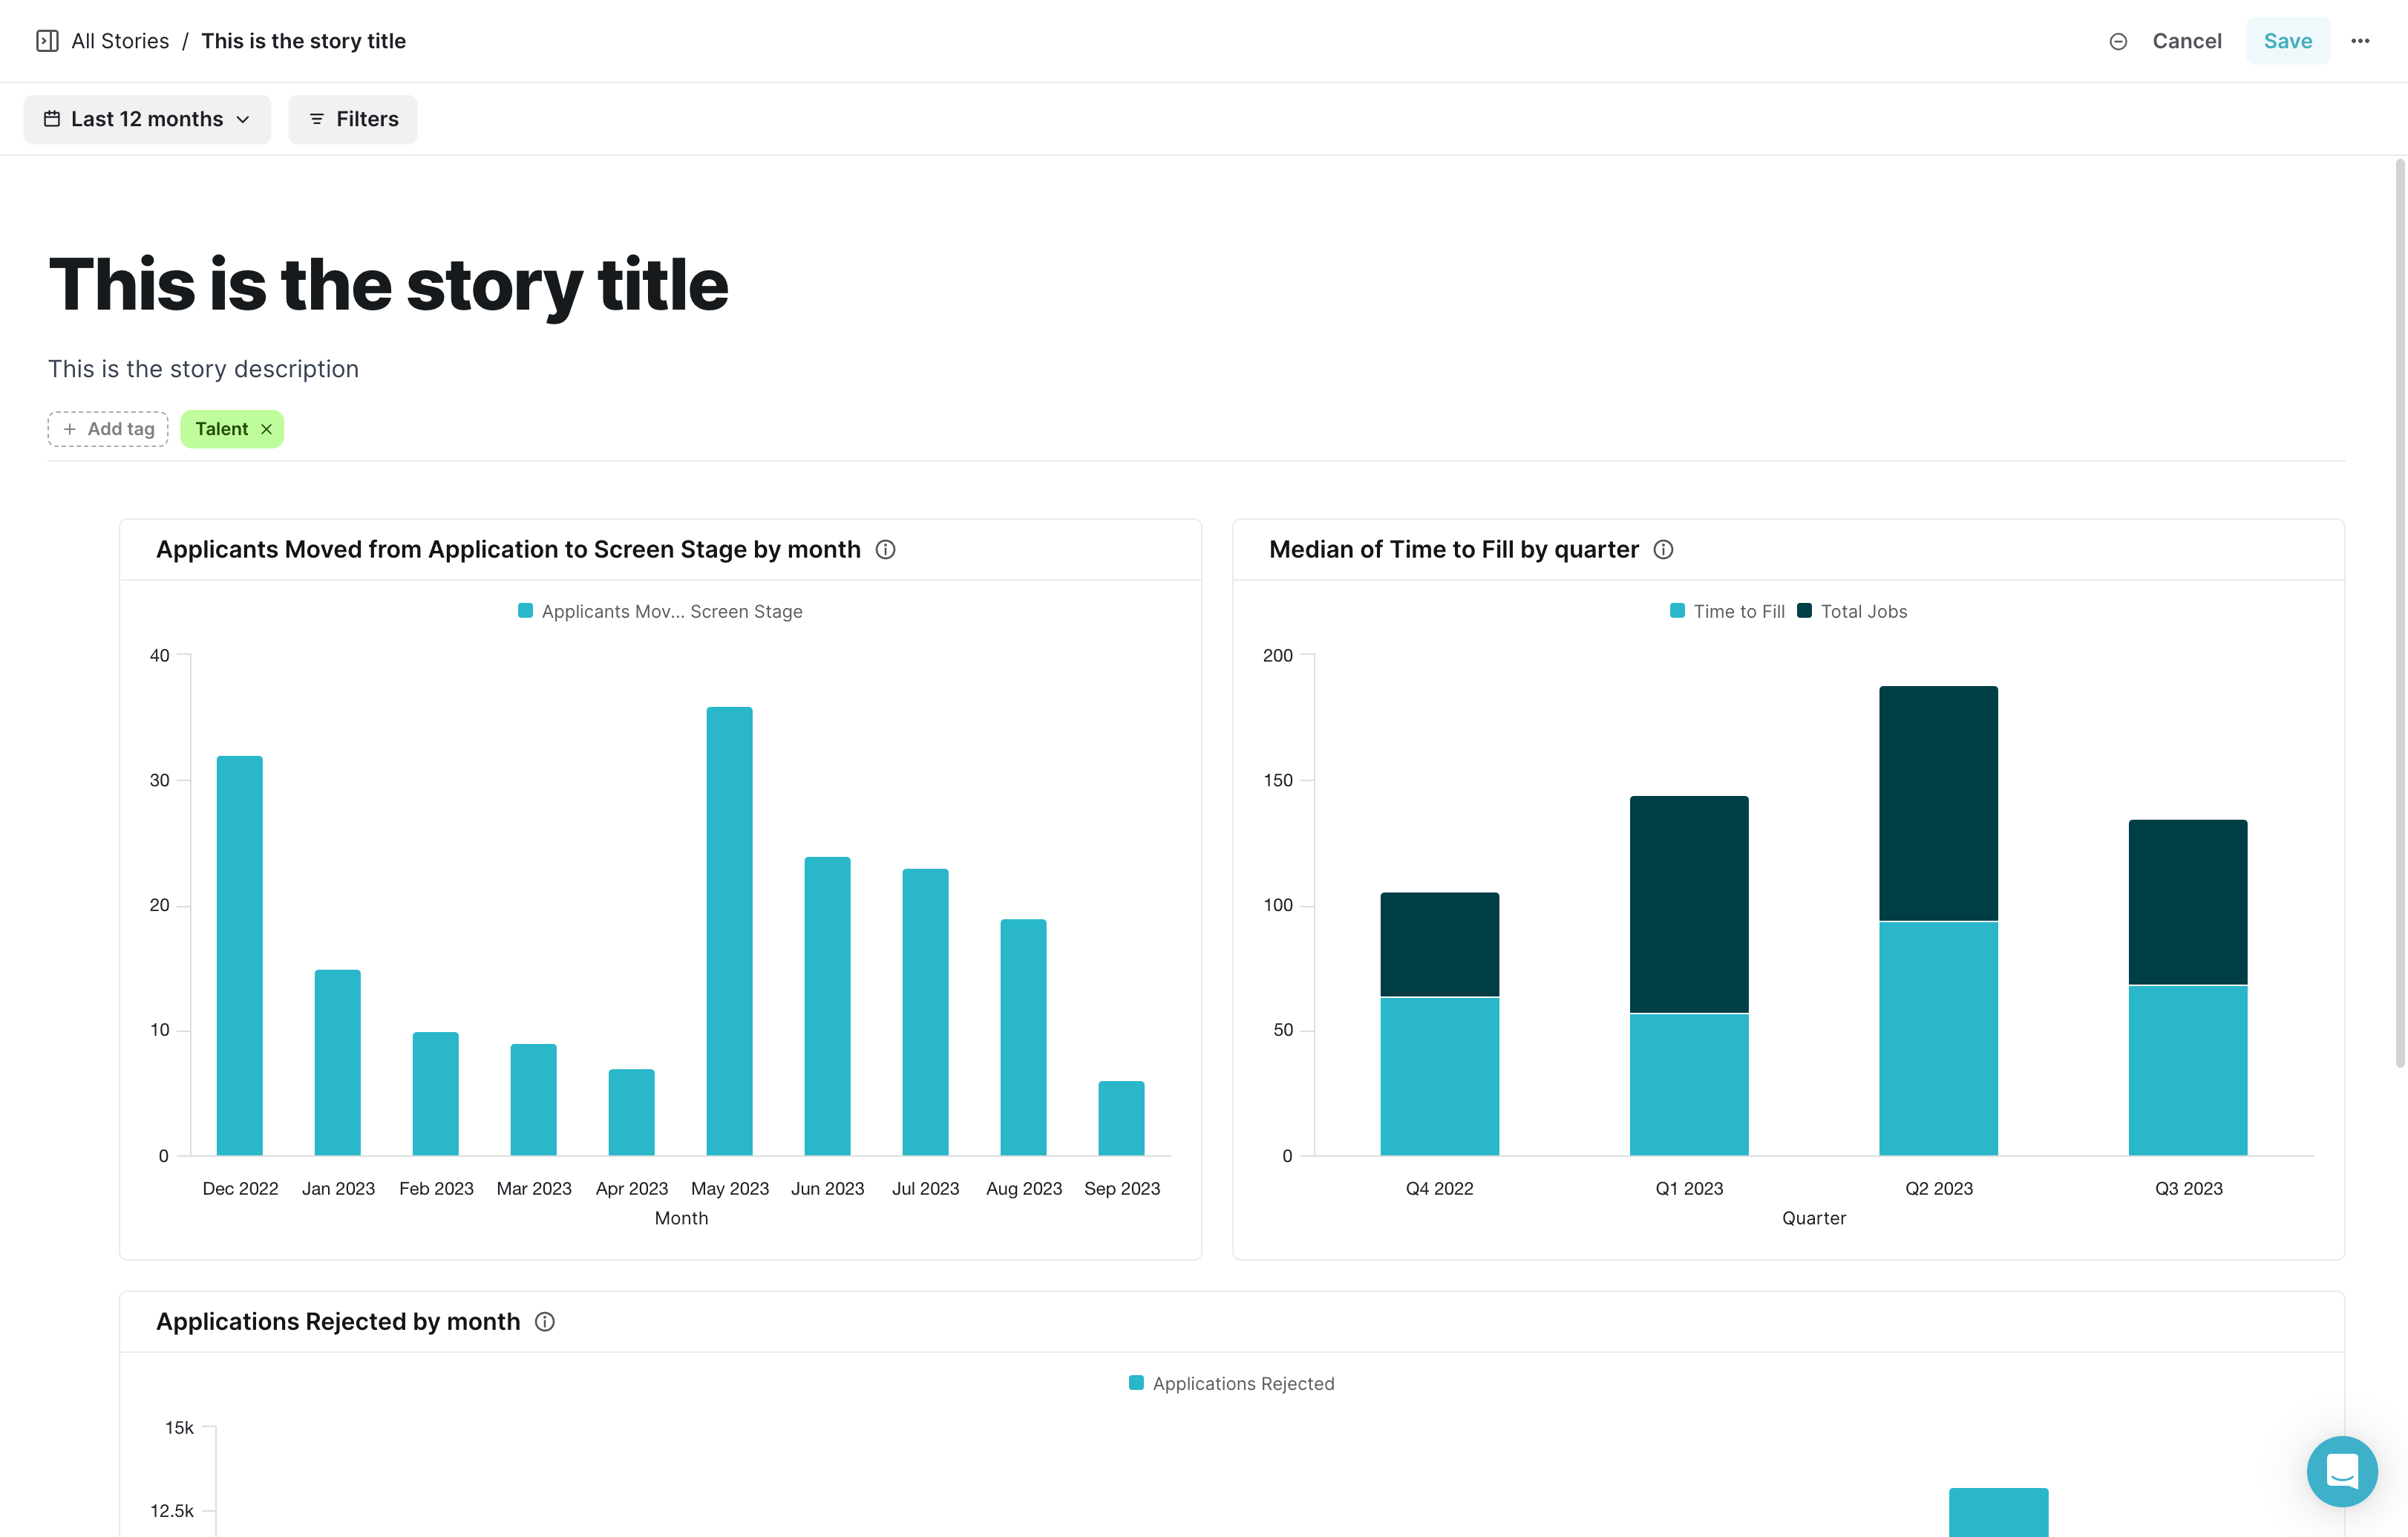
To add content to your story, click on the ‘Add block’ button at the bottom of the story editor. This will open a menu where you can choose from various content types, such as charts, text, and media. Simply select the desired content type and follow the prompts to add your content to the story. You can also click on the Plus button to the left of every row in the Story editor. Text Blocks Text blocks support rich formatting. After highlighting text, you can apply heading, bold, italic, underline, and strikethrough formatting. You can also create numbered or bulleted lists, insert hyperlinks, and change the color or background color. This allows you to customize the appearance of your text and make it more engaging for your readers. Media blocks To add media to your story, click on the ‘Add block’ button and select the ‘Media’ option. You can then upload images or embed videos from external sources such as YouTube or Vimeo. This allows you to enhance your story with visual elements that support your data-driven narrative.3. Organize your Story
Stories are built on a row-based layout, where each row can have multiple blocks. To add a new row, click on the ‘Add block’ button at the bottom for the story editor. You can then drag and drop using the drag handle.