Make sure to add eqtble to your Slack instance before using AI-Insights in Slack.
You might need to work with your IT team to get this set up. We do not read data but rather just the metadata via the AI so it is secure.1. If you get asked a question - answer it immediately in Slack by calling the eqtble app.
Type ’ /eqtble ’ to call the Slack bot.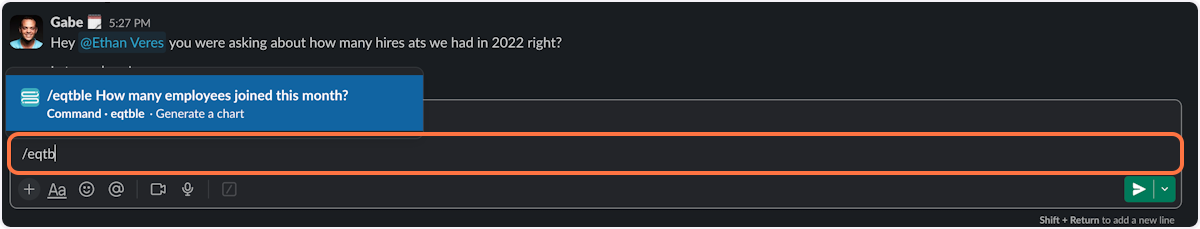
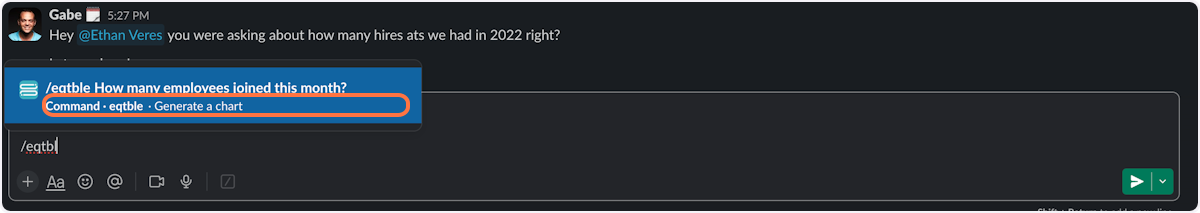
2. Click on eqtble
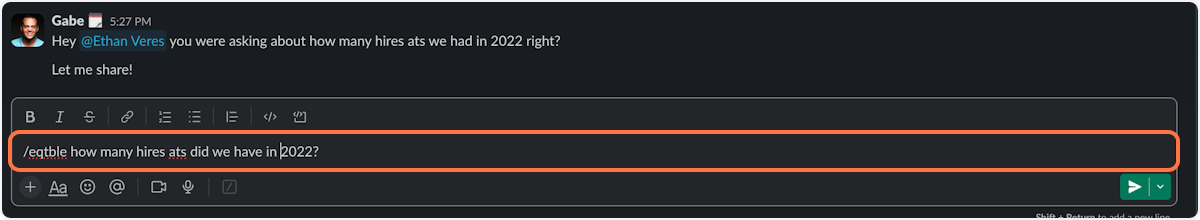
3. Type your question into the message box and wait for the chart to build
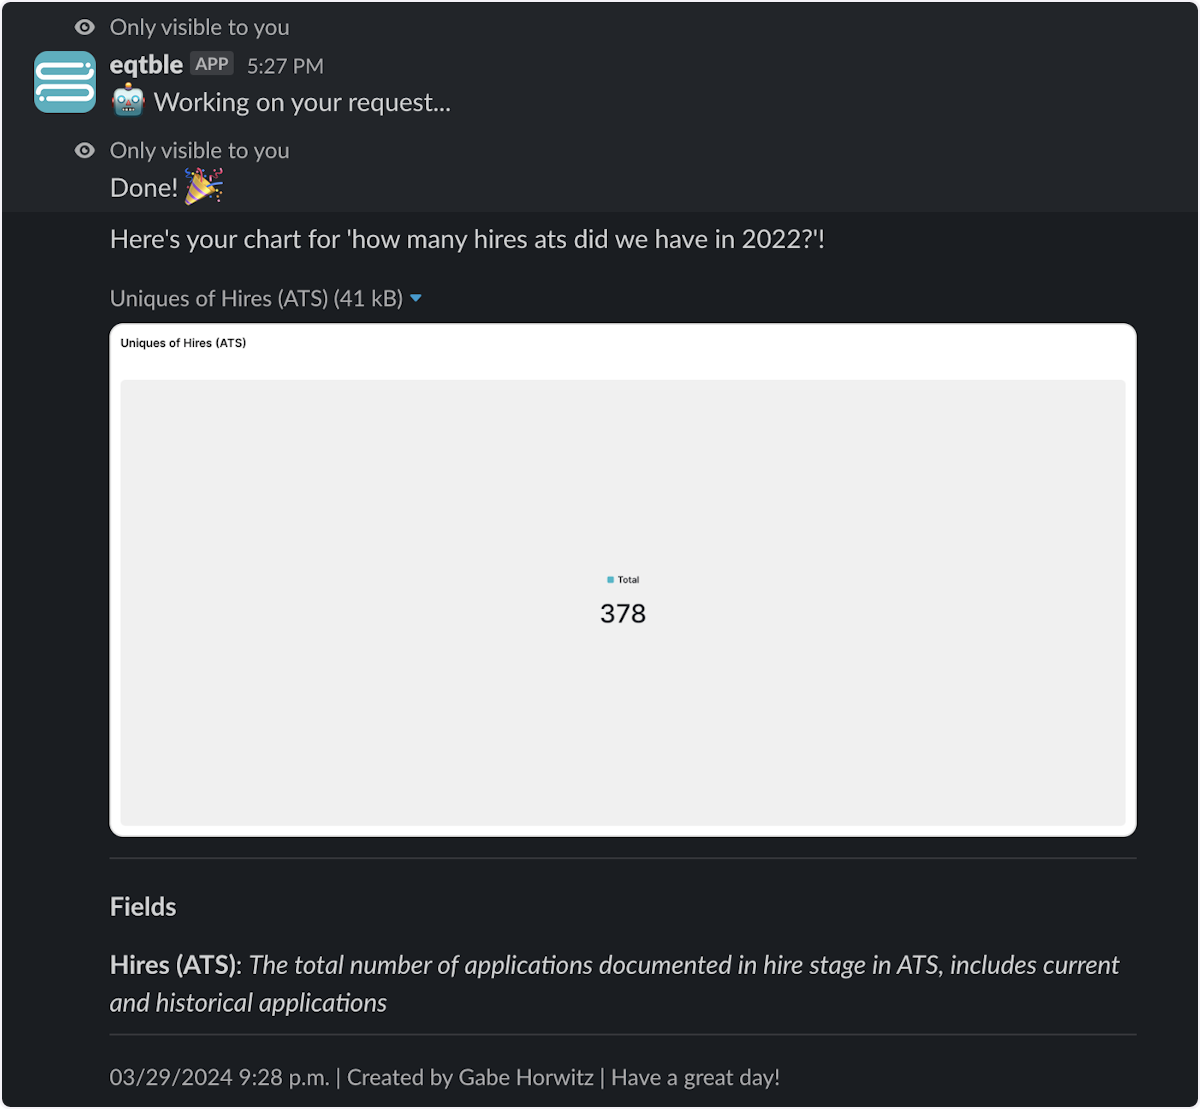
4. See your data and download the chart
Here are some example prompts to try:
- What source has the highest passthrough rate from review to screen?
- How many hires ats did we have in 2022?
- How many jobs were filled in the last year?
- Show me the applicant funnel
- What is the average time to hire?
- What is the time to hire by location?
- Show number of hires by source
- Show me list of open jobs
- What is offer acceptance rate by job department?
- Give me a list of candidates hired this month
- Show passthrough rates by source, include review to screen, screen to interview, and interview to offer
- How much time to candidates spend in each stage?
- How many jobs are currently open?
- What percentage of applicants withdrew from the hiring process?
- Show me number of open jobs and days opened by recruiter
Did we miss anything? Reach out to support@eqtble.com